


If you’re trying to grow your channel on YouTube, you might be feeling like you’re fighting a losing battle. This usually happens when people aren’t aware of how their channel is performing - for better or for worse. Being unaware of your channel’s performance is like driving a car blindfolded - you’re going forward, but you don’t know which direction you’re heading. This is where YouTube Analytics comes into play.
In this tutorial, we’re going to explain what YouTube analytics is and how you can use your analytics to gain insights into your channel performance and ultimately improve it. So, without further ado, let’s get started.
According to YouTube, YouTube Analytics allows you to monitor the performance of your videos, channels and content with up-to-date metrics and reports. It’s a part of the YouTube Creator Studio and is available for all YouTubers, no matter how big and how small.
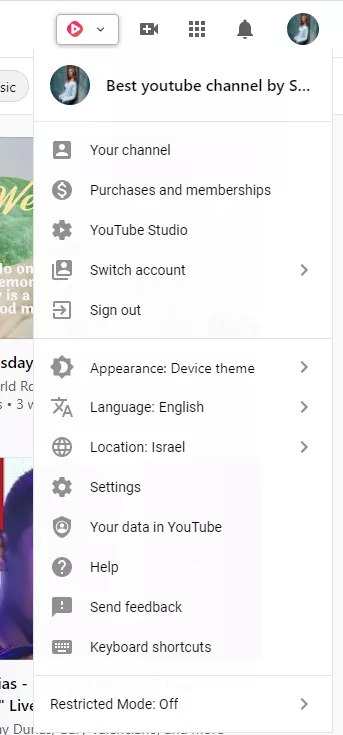
Your YouTube Analytics is located inside your YouTube Studio. To access your analytics, go to YouTube’s front page and click on your channel icon. Then, in the drop-down menu, click on “YouTube Studio” -
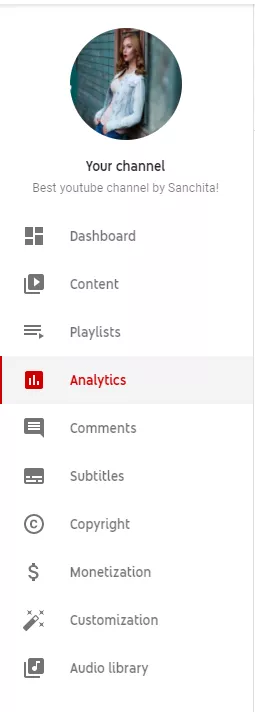
Next, on the left sidebar, click on Analytics. That’s it, you’re in!
Audience Retention is a key factor in ranking in YouTube’s platform as a whole. When you have good audience retention rates, you’re more likely to be promoted both in the SERP (Search Engine Results Page) and in the video suggestions/recommendations bar, as well as on homepages and discovery pages (such as the Trending tab). The higher your audience retention is and the more stable the graph is, the better! Without analytics, you won’t be able to see what your audience retention is like, so it’s really important to look at your analytics for this metric.
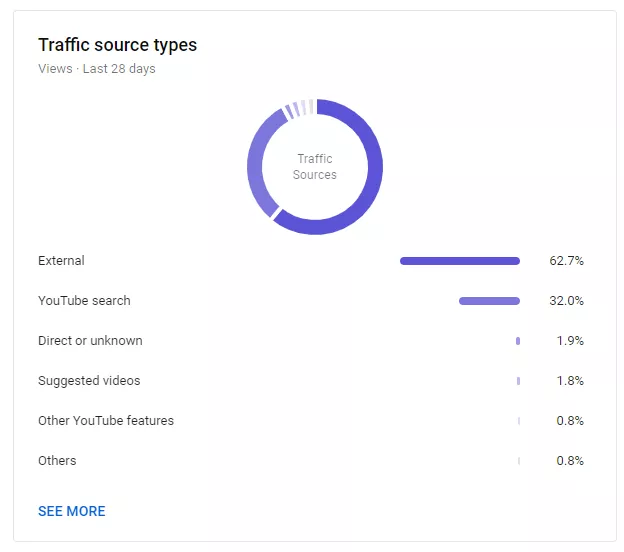
Traffic sources are the places people find your videos. Without looking at your analytics, you won’t have a clue where people are finding your videos. This is important to know because when you have an idea of how people are discovering your videos, you can tailor your SEO strategy and your content to accommodate these traffic sources. It also helps you know whether your SEO strategy is working, for example, if most of your video views come from the search engine (or YouTube Search).
Great video performance isn’t measured by audience retention or watch time alone. A well-performing video also has a high engagement rate - we’re talking about comments, likes/dislikes and shares. Your analytics can uncover how much engagement your videos are generating. The higher the engagement rates, the better your video is performing on the platform!
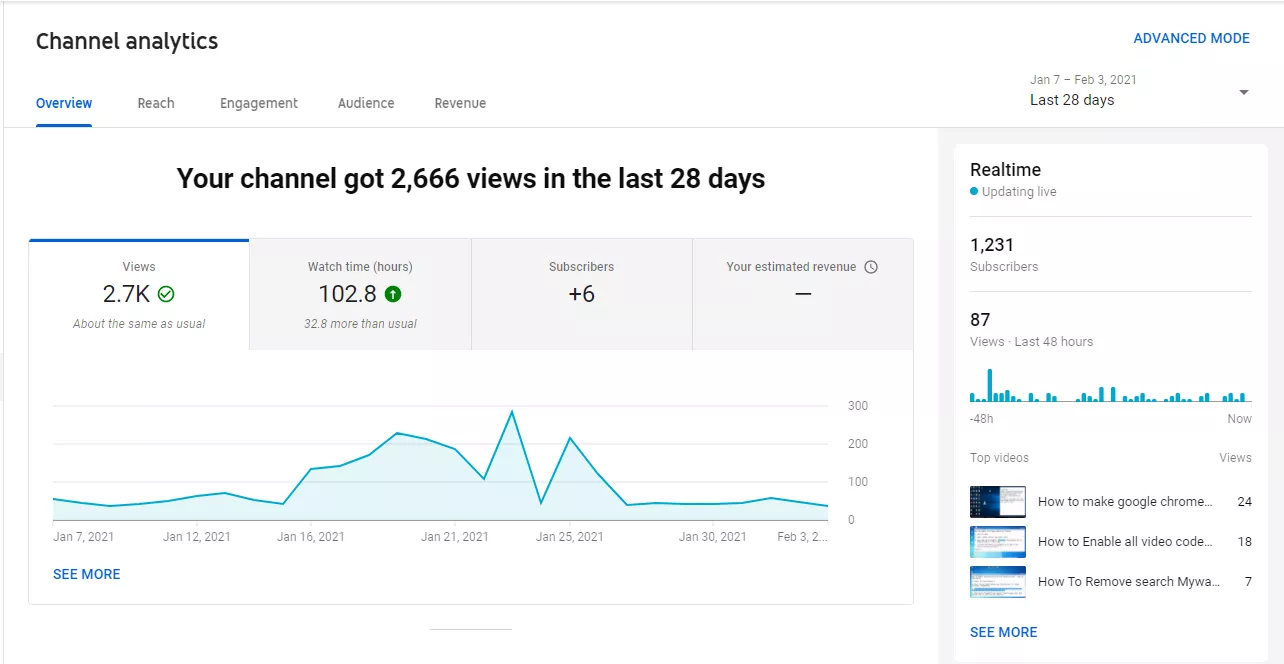
The Overview tab does exactly what the name suggests - it gives you a general overview of how well your channel is performing. In it, you will find the main graph - it’ll be divided into:
On the right hand side, you will see your Realtime graph. This graph updates “live” and shows you how many subscribers your channel has and how many views it gained over a period of 48 hours. It also shows you the top videos for the last 48 hours.
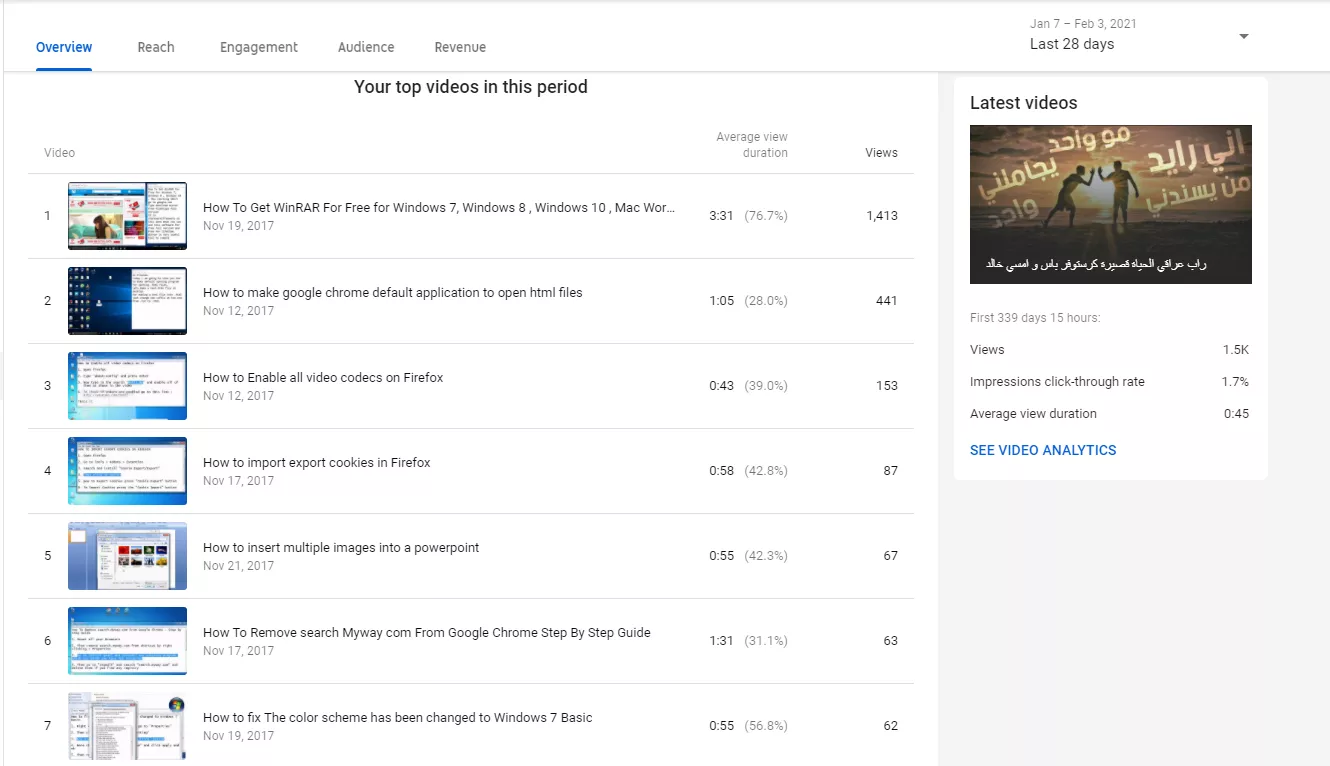
Scrolling down, you’ll find your channel’s top videos in a given period (the default is 28 days) and the latest video you uploaded (along with general stats on the video like views, impressions CTR and average view durations).
This tab is important for keeping tabs on your channel at a glance.
From here, you can dive deeper into your channel analytics to learn even more information and gain even more insights into how well your channel is doing.
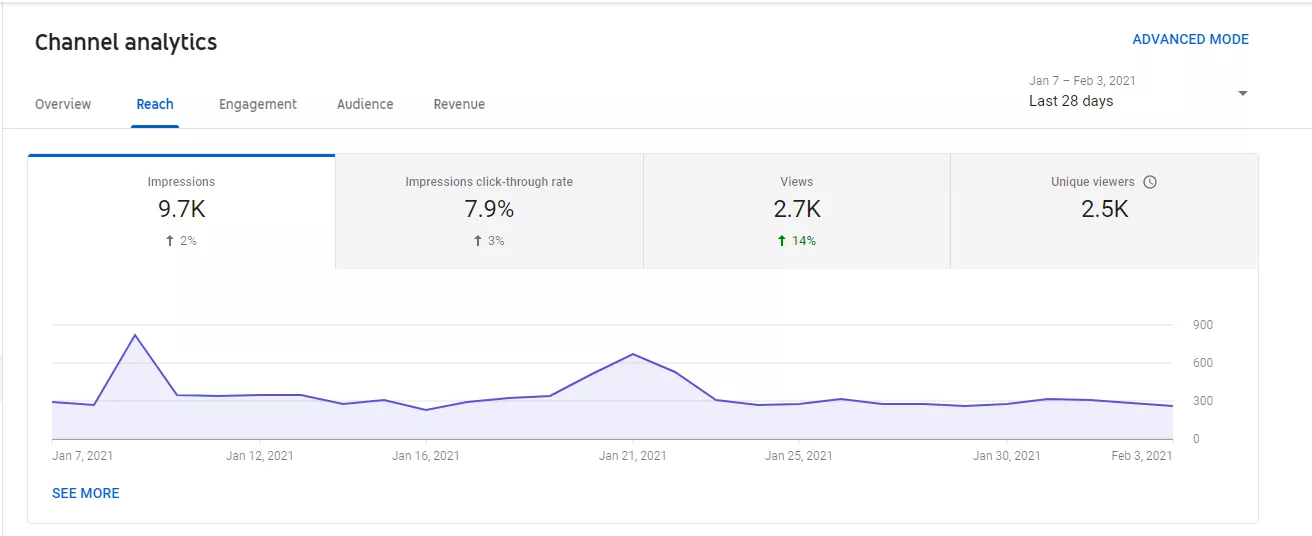
This tab is all about your channel and content’s Reach on the platform. The graph shows you statistics for the following aspects:
Scrolling down, you will find your Traffic Sources graph. This graph shows you where people find your content -
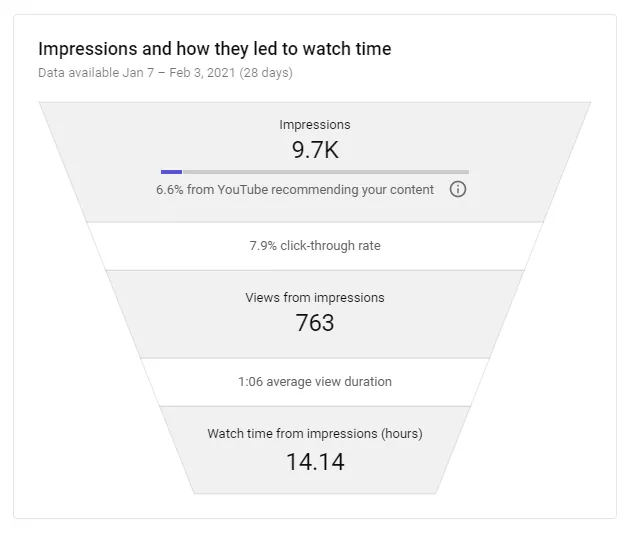
Next to it is your Impressions And How They Led To Watch Time funnel graph. This funnel shows how many times thumbnails were shown to users on YouTube (impressions), how frequently those thumbnails resulted in a view (CTR), and how those views ultimately led to watch time -
Then, scrolling down further, you’ll find a detailed breakdown of the video’s traffic sources. This will show you what playlists your videos are in, what search engines your videos are on, where your videos are suggested on the platform and what keywords people use to find your content on the platform -
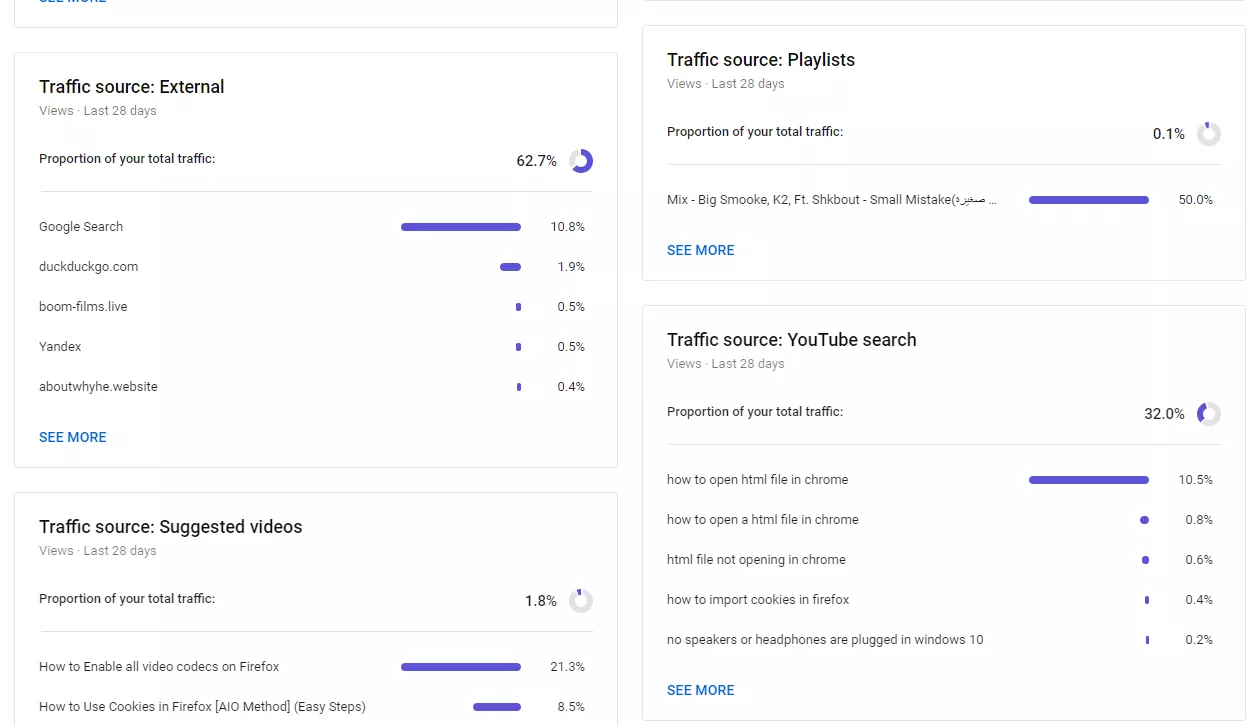
This tab is important for understanding how and where people find your content on the platform. It also helps you determine whether your thumbnails are working or not and whether your YouTube SEO strategy is tight enough or needs improvement.
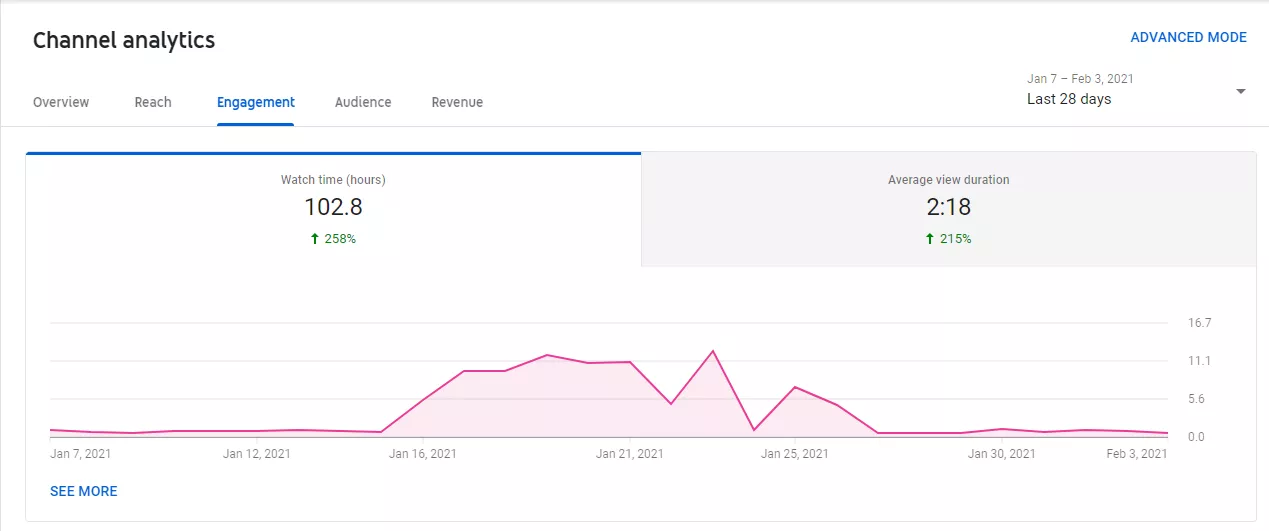
This tab is all about engagement on the YouTube platform. The main graph is divided into two sections:
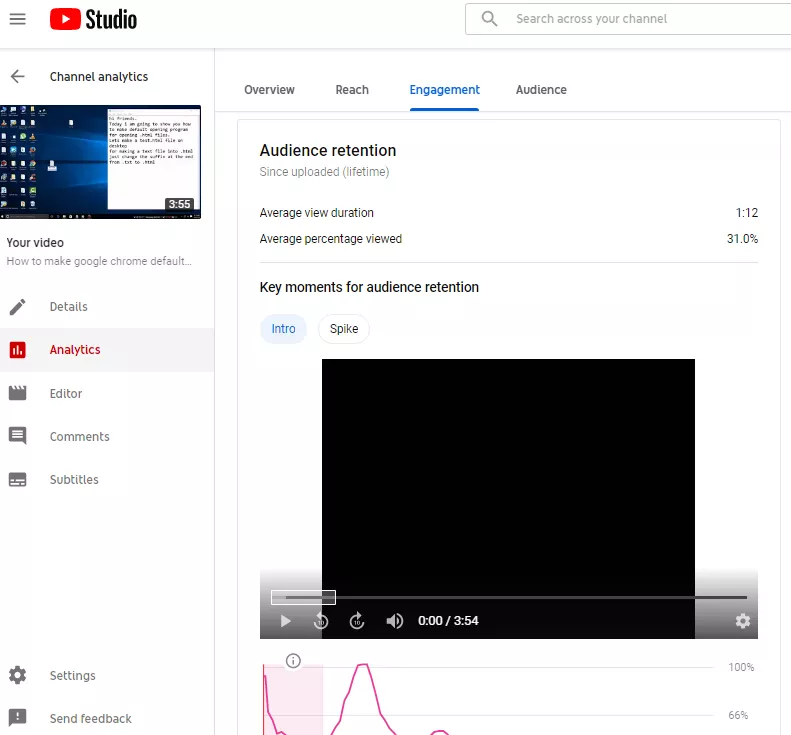
Scrolling down, you will find the Key Moments For Audience Retention section. This will show you how well your audience retention is for your latest video - where do people click off, how much of your video they watch and how many people (in percentages) are still watching after 30 seconds of your video -
Scrolling down even further, you will find “Top” sections - meaning top videos, top videos by end screens, top end screen elements top cards and top playlists.
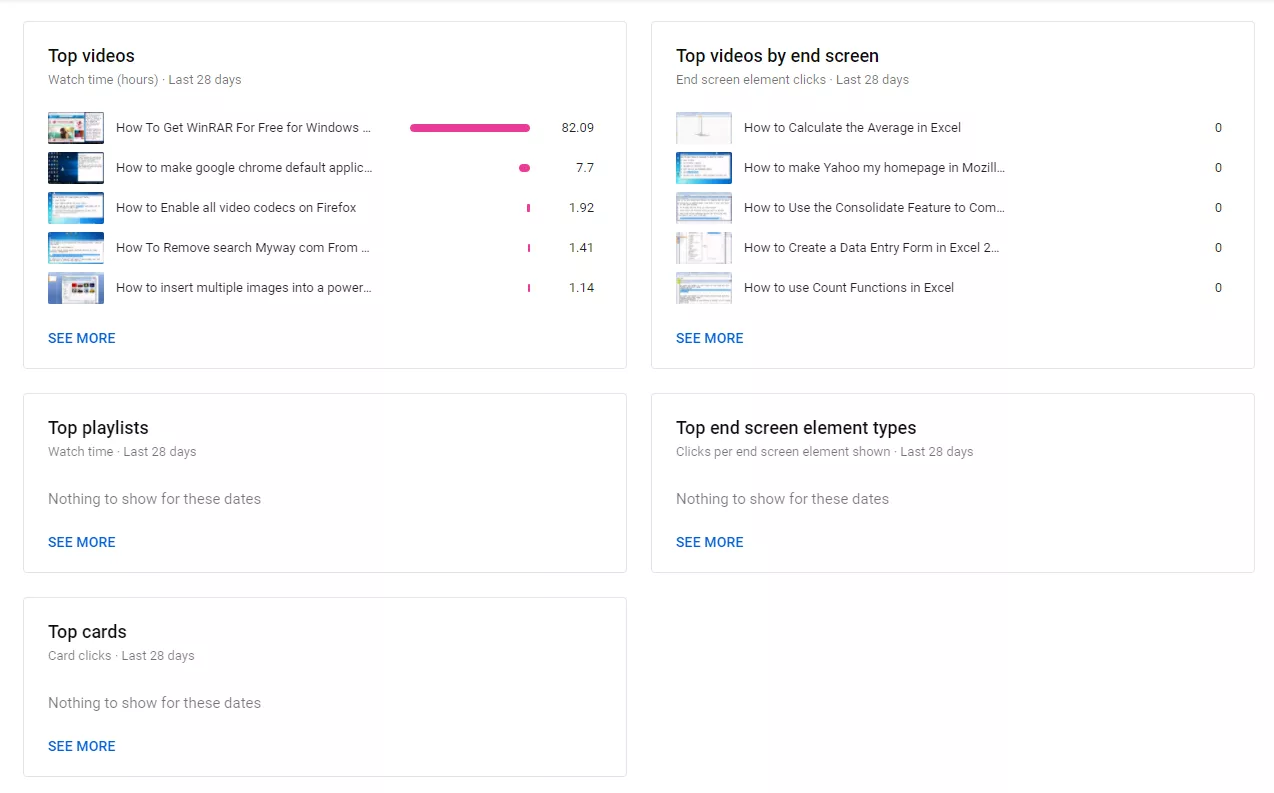
This is important if you want to learn more about how people are interacting with your videos - are they watching them all the way through? Are they clicking any cards or end screen elements? Are they watching your playlists?
This will also help you understand if your end screen elements are serving their purpose or not - if no one’s clicking on any, either you don’t have any cards or end screens on your videos (and you should definitely add those) or people just ignore them. If people ignore your end screens and cards, they might need some tweaking.
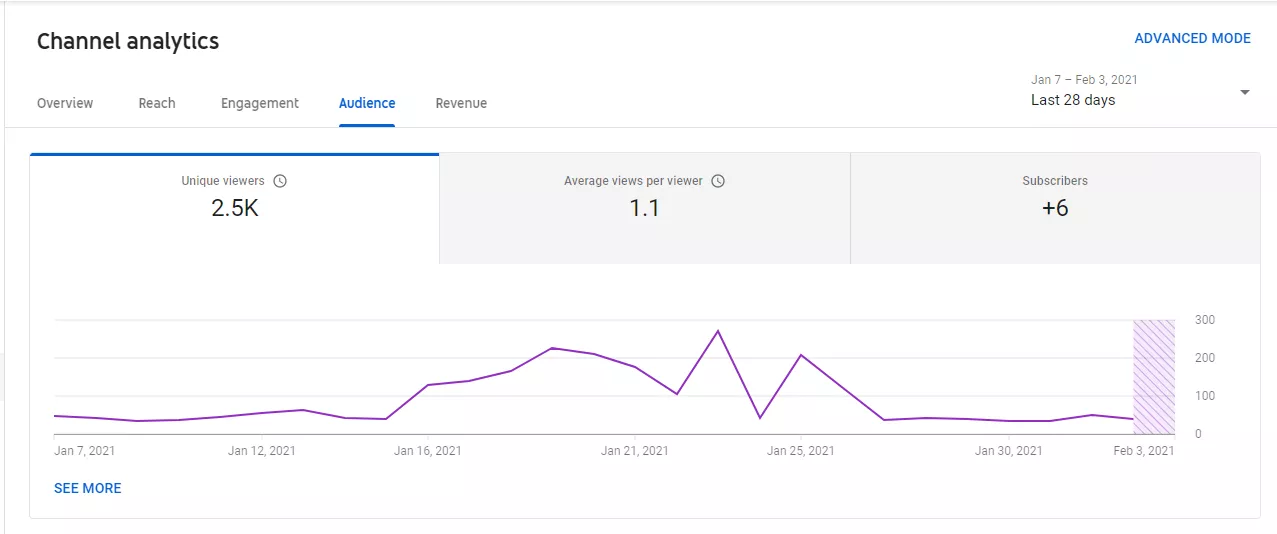
This tab is all about who is watching your audience. The main graph is divided into three sections:
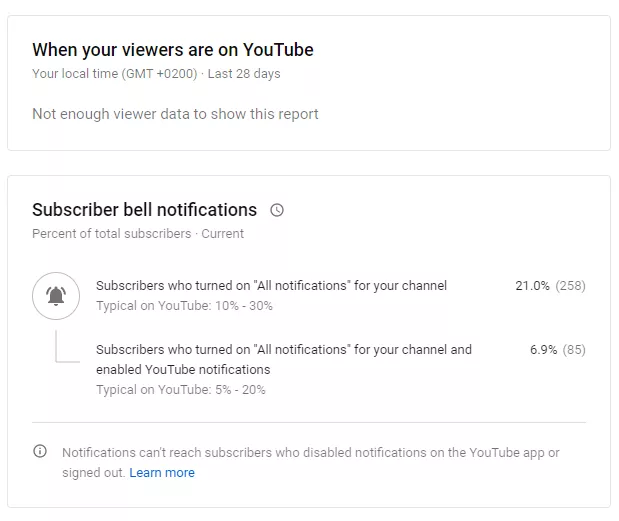
Scrolling down, you’ll find many other sections to look at. The first two are the When Your Viewers Are On YouTube and the Subscriber Bell Notifications. These two sections allow you to see when your subscribers are usually online (and therefore when the best time to upload is) and how many of your subscribers turned on the notification bell for your channel (and are therefore interested in your videos enough to not want to miss them as soon as they go live on the platform).
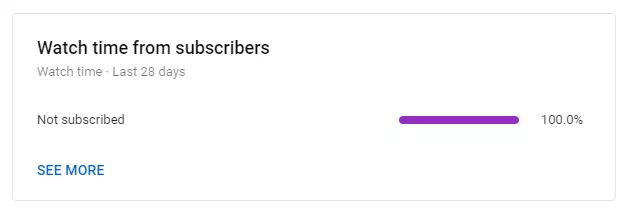
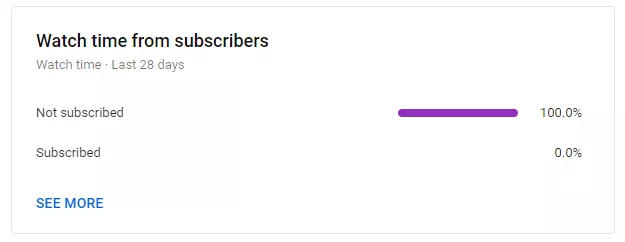
Up next we have Watch Time From Subscribers. This section will show you how much watch time is gained by your subscribers and how much is gained by non-subscribers. This is important because you want to know that your subscribers are watching your channel. If they’re not, maybe you’re doing something wrong or not interacting with them enough to make them want to watch your videos -
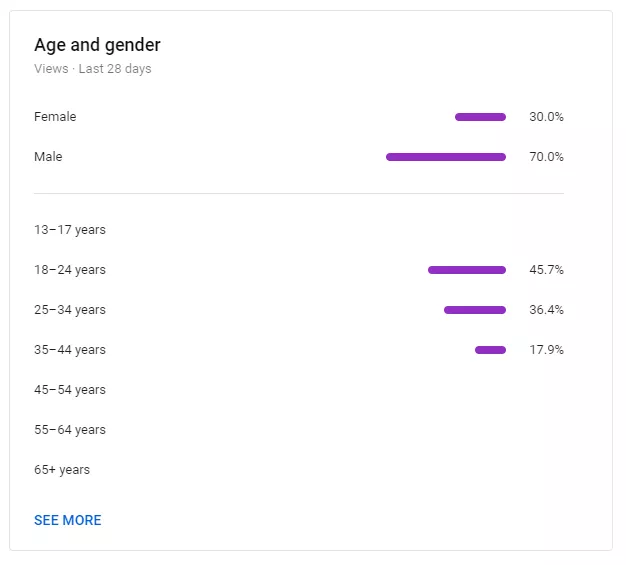
Then we have the Age And Gender section -
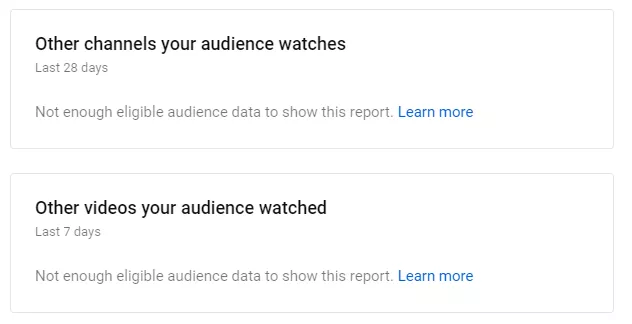
Next up we have the Other Channels Your Audience Watches and Other Videos Your Audience Watched -
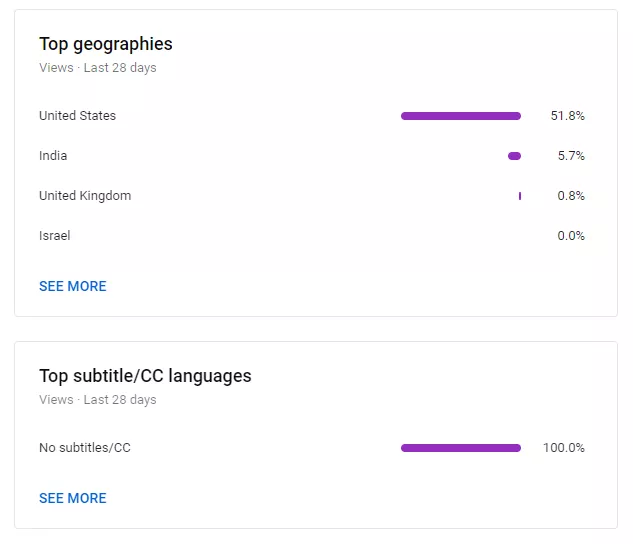
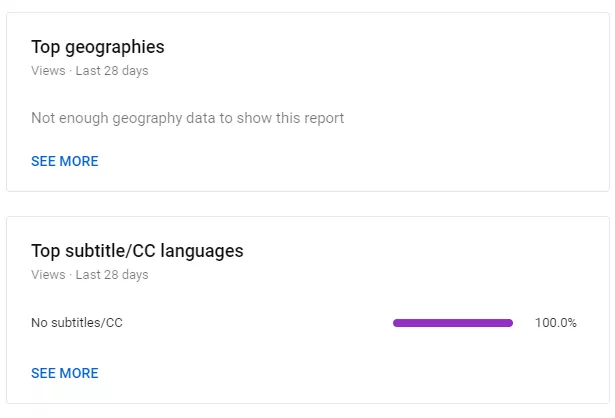
Finally, we have Top Geographies and Top Subtitles/CC Languages sections. This will show you where your audience is from and whether they’re using the subtitles/CC function while watching your videos to be able to understand them:
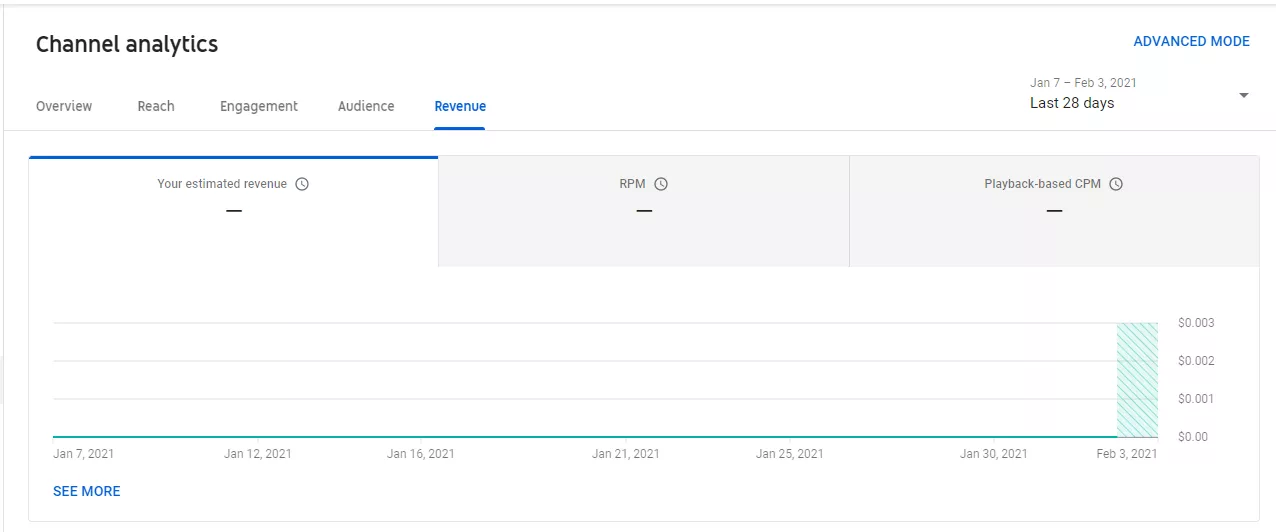
Since our example channel isn’t monetized you can’t see any data. However, if your channel is monetized, you will find all the data about your channel revenue here. The main graph is divided into three sections:
Below this graph you’ll find other sections. The first section is your Monthly Estimated Revenue, and it will show you what your revenue was over the last six months, month-by-month. As your channel grows, so will your revenue.
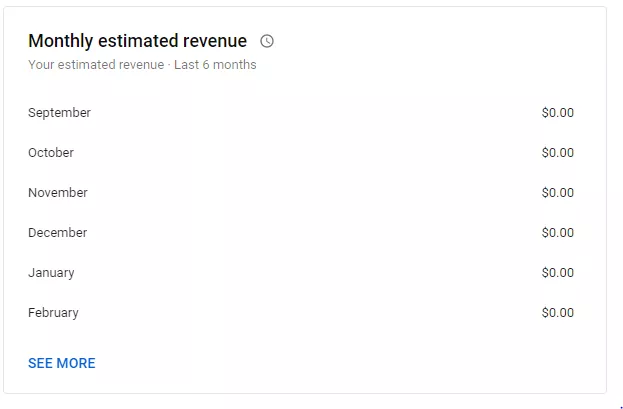
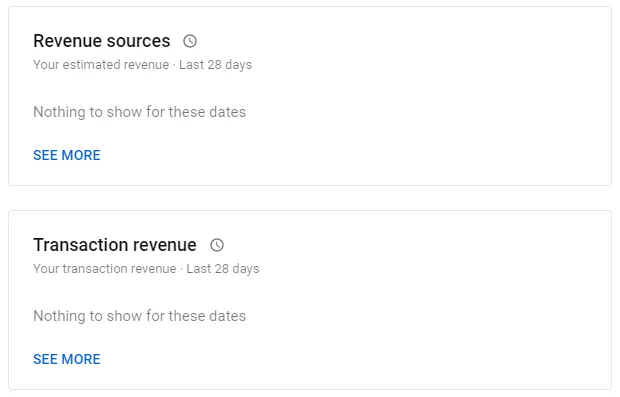
The next two sections will show you your Revenue Sources (memberships, ads, Super Chats and Super Stickers) and your Transaction Revenue -
Finally, you’ll see the Top Earning Videos and Ad Types sections. These sections will show you which videos are your highest-earning videos and which ad-types generate the most revenue for your channel.
This tab is important for keeping up with your money-making aspect of YouTube.
If your revenue isn’t growing and changing, it means that people stopped watching your videos and interacting with them and that it might be time for a change.
Keep in mind that revenue does tend to fluctuate after the holidays, so you might find that your revenue was very high during December and very low during January. That’s perfectly normal and happens to everybody on the platform.
Your video analytics will be almost identical to your channel analytics. You will see the same graphs and sections, with minor changes -
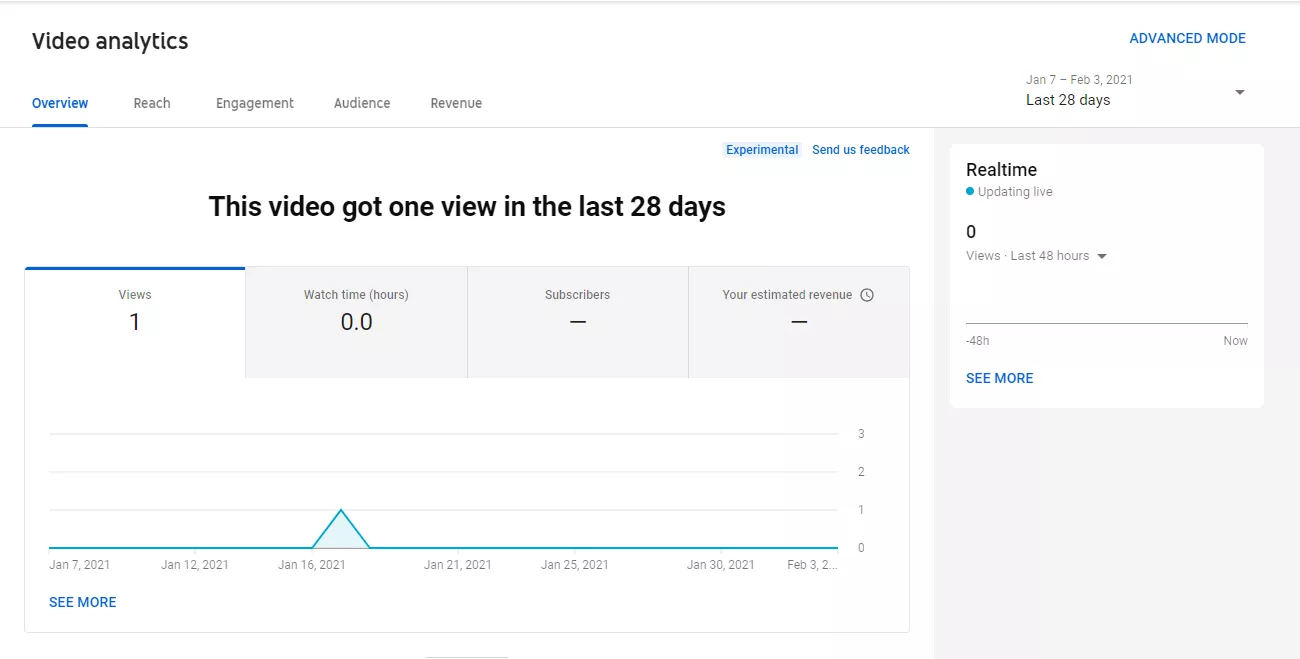
This tab gives you an overview of how well your video performed. The main graph is divided into four sections:
On the right side, you will find the Realtime section. This section will show you how many views were gained over 48 hours and it updates live.
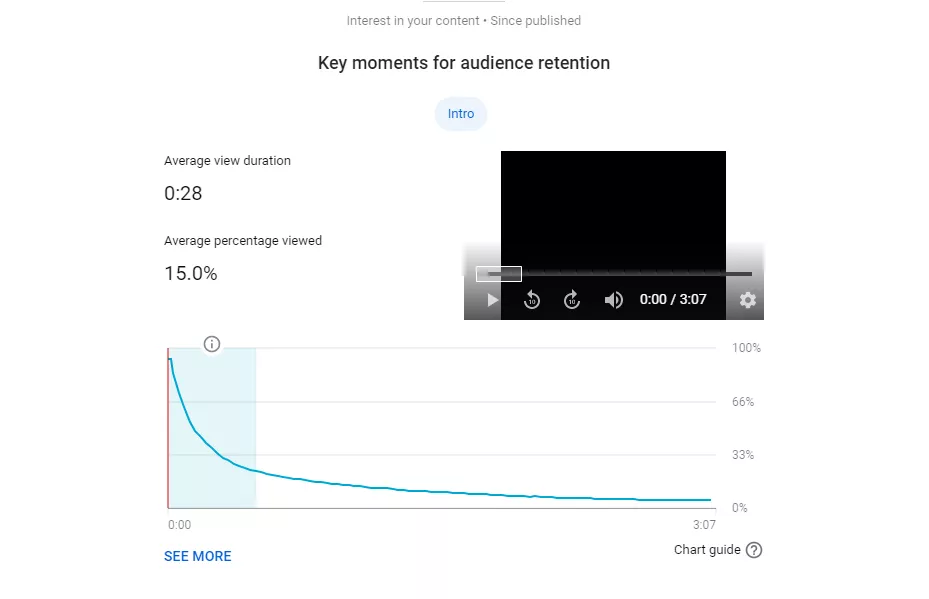
Scrolling down, you’ll find the Key Moments In Audience Retention section, which will show you your average view duration and average percentage viewed, as well as a graph showing audience retention trends:
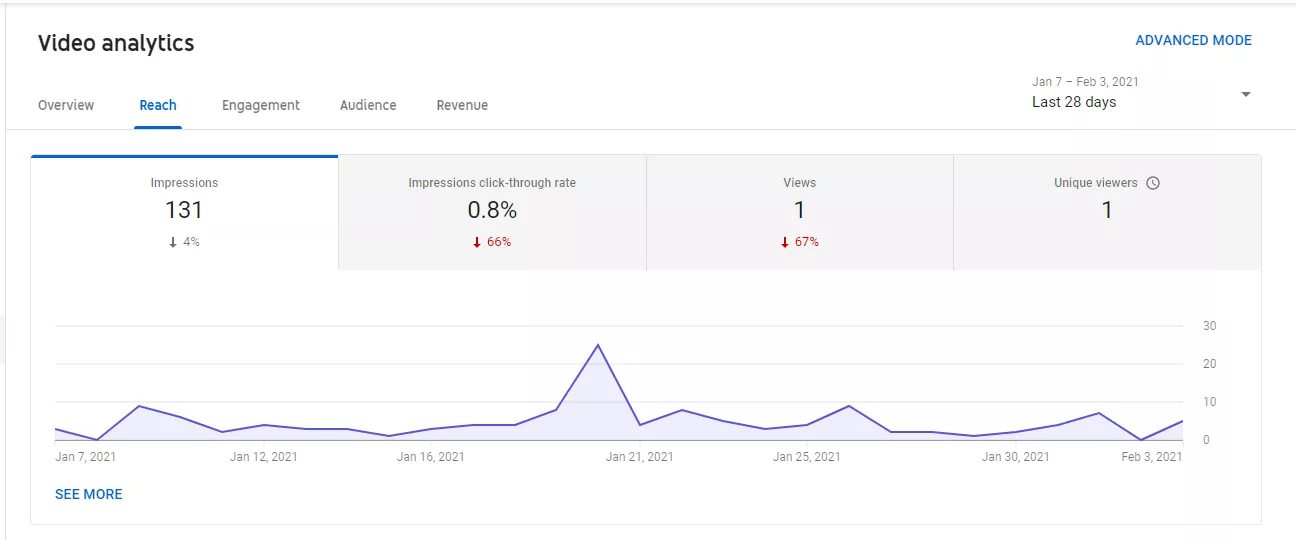
This tab is all about the video’s reach on the platform. The main graph is divided into four sections:
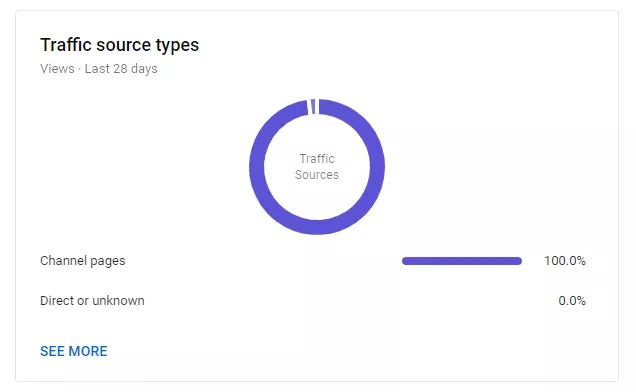
Scrolling down, you will find the Traffic Source Types chart. This chart will show you where people find your video.
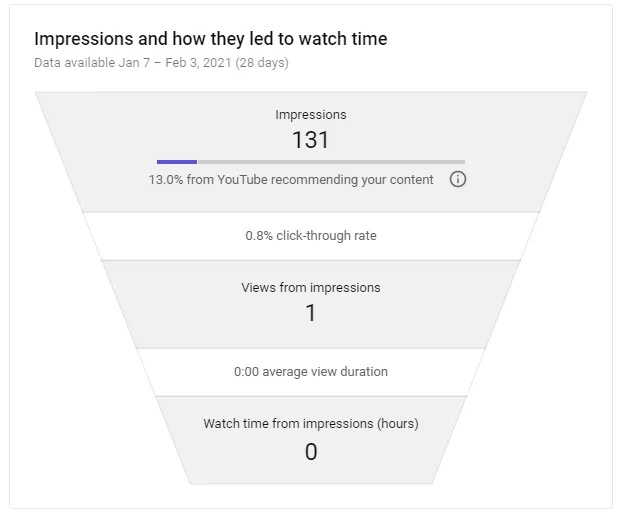
You will also find the Impressions And How They Led To Watch Times funnel chart, which shows you how your impressions turned into views and watch time.
This chart is really helpful in determining the performance of a thumbnail and your video, and is very important to look at. You wouldn’t want to miss out on it.
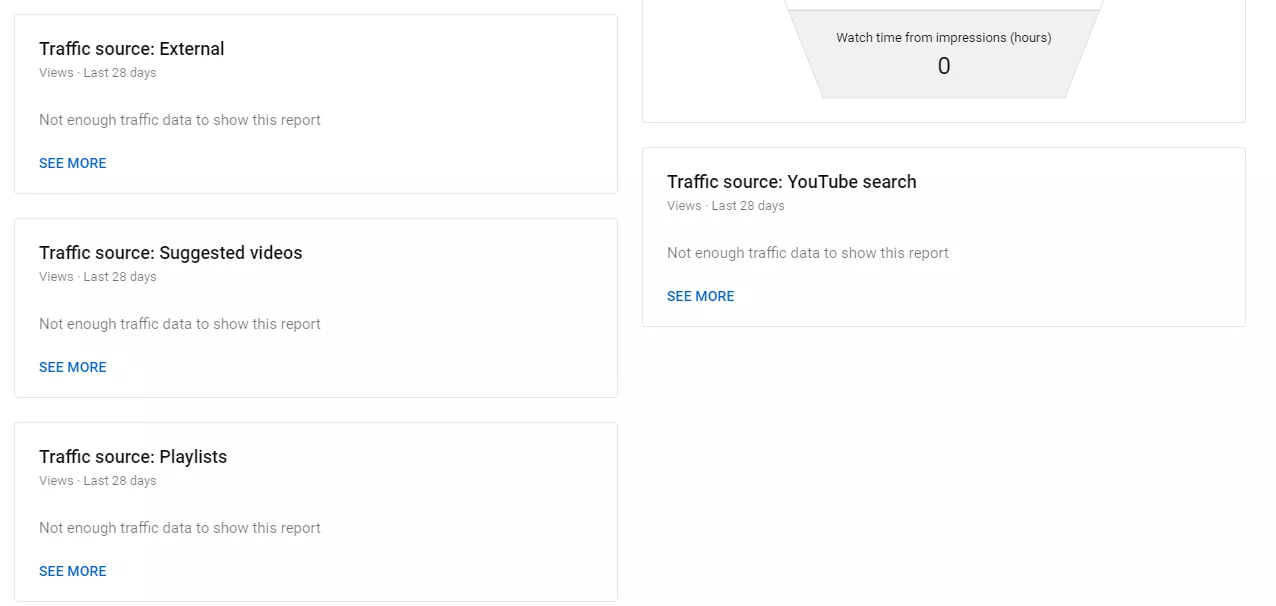
Scrolling further down, you will find a breakdown of your channel traffic sources -
This is important to make note of to find out how people are finding your video on the platform and on the internet.

The main graph is divided into two sections:
Scrolling down you will find the Key Moments For Audience Retention graph, which is identical to the one in the overview tab -
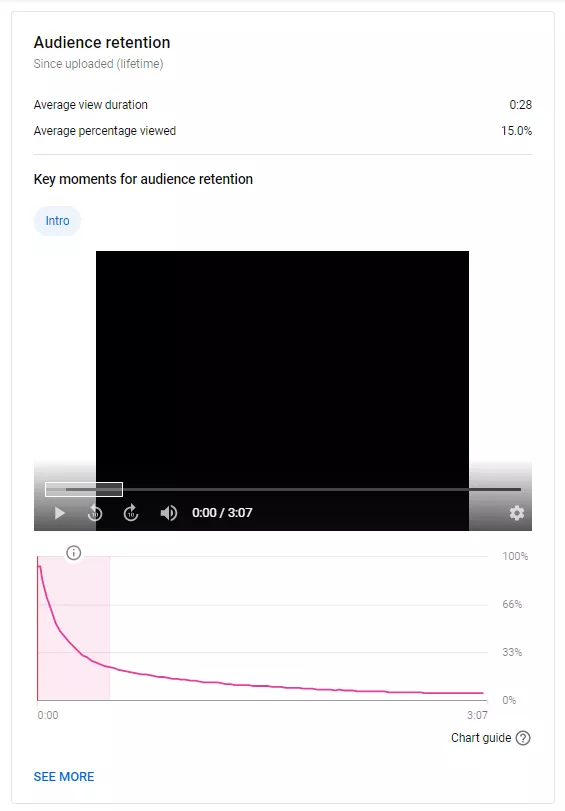
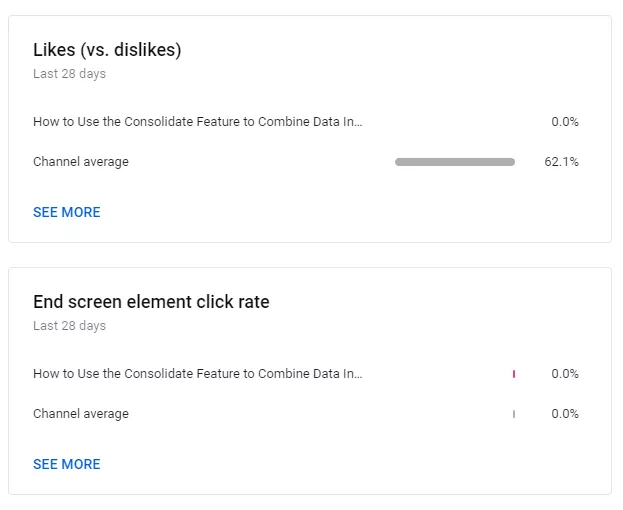
Right next to it you will find two sections: Likes (Vs. Dislikes) and End Screen Element Click Rate. These two sections will show you how people are interacting with your videos - are they liking and disliking it? Are they clicking on any end screen elements?
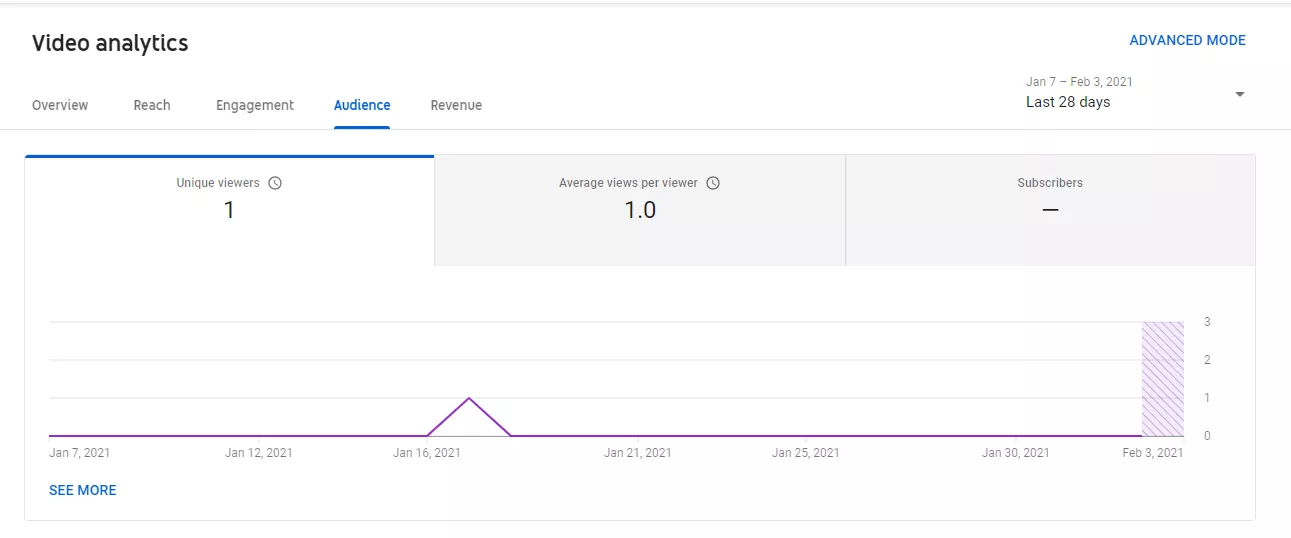
This tab is all about the audience themselves. The main graph is divided into three sections:
Scrolling down, you will find the Watch Time From Subscribers section. This section will show you how much watch time was generated by subscribers compared to non-subscribers -
This will give you an indication of whether your subscribers are watching your content or not. If they’re not watching your content, you might want to change your content promotion and marketing strategies.
Up next, you’ll find the Top Geographies and Top Subtitles/CC Languages sections. These will give you an indication of where your audience is from and whether or not they turned on the subtitles/CC function to watch your videos. This is important because if most of your viewers are non-natives to the language you’re speaking, you might want to consider adding subtitles and CC to make the video more accessible for audiences from all over the world.
Finally we have the Age And Gender section: This section is important because you have to know who the people in your audience are in order to make tailored content that they’ll find engaging and compelling -

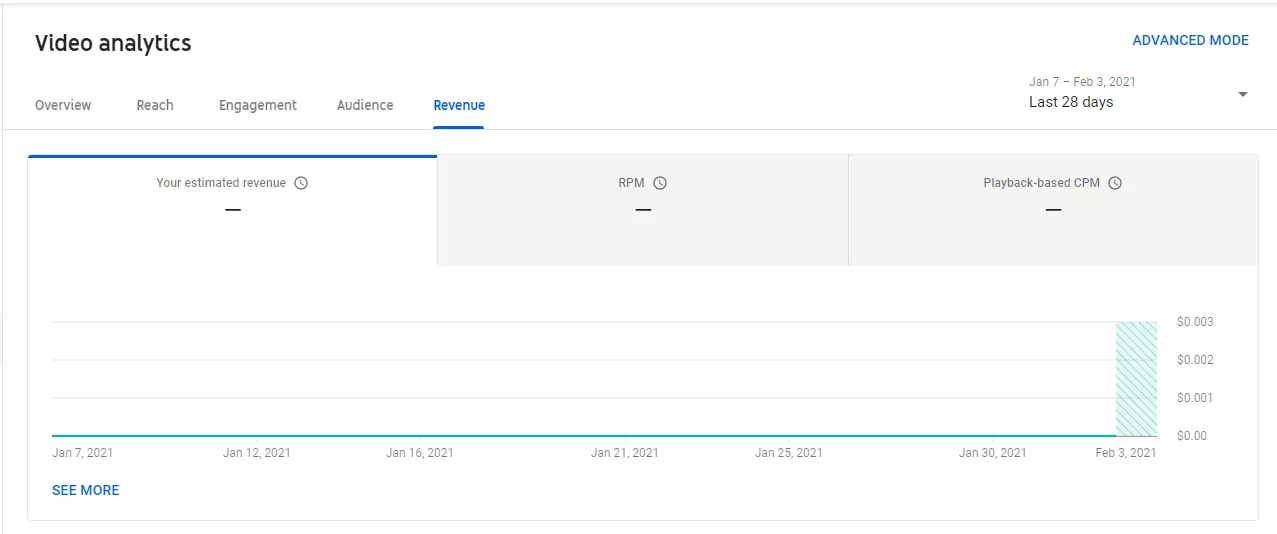
This tab is all about revenue for the specific video. The main graph is divided into three sections:
Scrolling down you’ll find three sections, identical to those on the channel analytics: Revenue Sources, Transaction Revenue and Ad Types.
These are important to make note of in order to maximize your revenue from certain ad types on your videos.
You can also see which revenue source is making you the most money on that specific video -
YouTube Analytics tools can help you if you’re unsure of how to use YouTube analytics or how to read YouTube analytics and you want the data and information presented to you in a more convenient way than it is presented on the Analytics page in your YouTube Studio dashboard. While this tutorial did explain how to read your YouTube analytics, you might want an external tool with more functions and metrics to help you out. So, for this, we gathered 7 of the most popular YouTube analytics tools on the internet:
In this article, we guided you through the YouTube channel analytics and video analytics. We’ve gone through every graph, chart and section and highlighted the importance of them all, so you’ll never be confused or left wondering why YouTube deemed something important to look at. We hope you found this article useful and we wish you good luck and success in your YouTube career!
